Modeling Wine Quality with Machine Learning
Wine Quality
Project Overview
The goal of our project was to compare the performance of various machine learning classification models. The data used are quality ratings (0 to 10) for red and white wine based on 11 physicochemical measurements in the wines. Red and white wine models are analyzed separately. There are 11 features for each wine type. Ten supervised machine learning models were used.
The datasets can be found here:
The features used in the models:
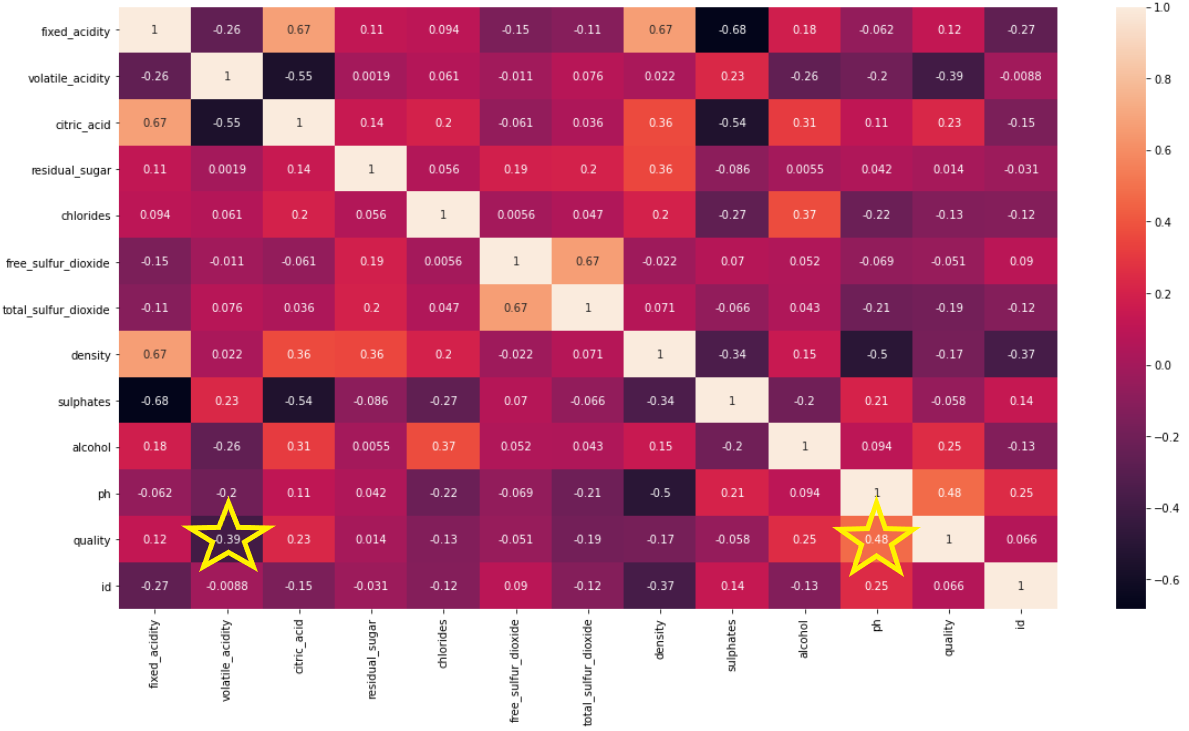
Looking across the quality rating row there are two features with the highest correlations. The correlation for pH is positive = 0.48. As the pH level of wine increases the rating also increases. Volatile acidity has the largest negative correlation = -0.39. Quality ratings decrease as volatile acidity increases.
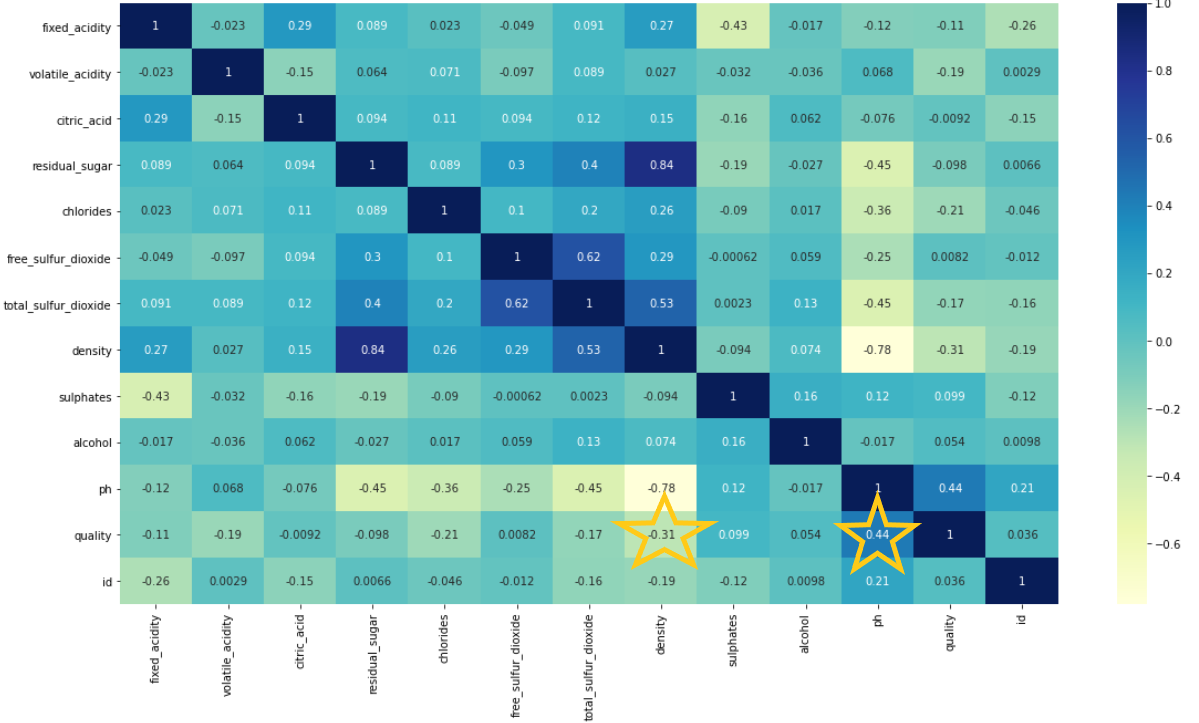
Looking across the quality rating row for white wine there are two features with the highest correlations. The correlation for pH is positive = 0.44. As the pH level of white wine increases the rating also increases. Density has the largest negative correlation = -0.31. Quality ratings decrease as density increases.
Machine Learning Classification Models:
Target: recoded quality score (0-6 = Not Good (0) and 7+= Good (1))
The dashboard is also available on Tableau Public: Wine Story
Group Members:
Paula Lindgren
![]() ,
Corey O'Brien
,
Corey O'Brien
![]() ,
Quinn Dong
,
Quinn Dong
![]()